One Person, 34 Services: How AI Tooling Changed the Economics of Running a Production-Grade Homelab
A platform engineer's honest account of using Claude Code, MCP integrations, and GitOps to manage a Kubernetes cluster that has no business being run by a single person.
The Absurd Premise
Here are the numbers. Three Proxmox bare-metal Dell Optiplex 3070 micro nodes. Nine virtual machines running MicroK8s. Twenty-five Helm charts pulling from 33 upstream chart dependencies. Eighteen ArgoCD Applications orchestrating continuous deployment. Nearly four thousand git commits spanning several years of incremental improvement. And one person keeping it all running.
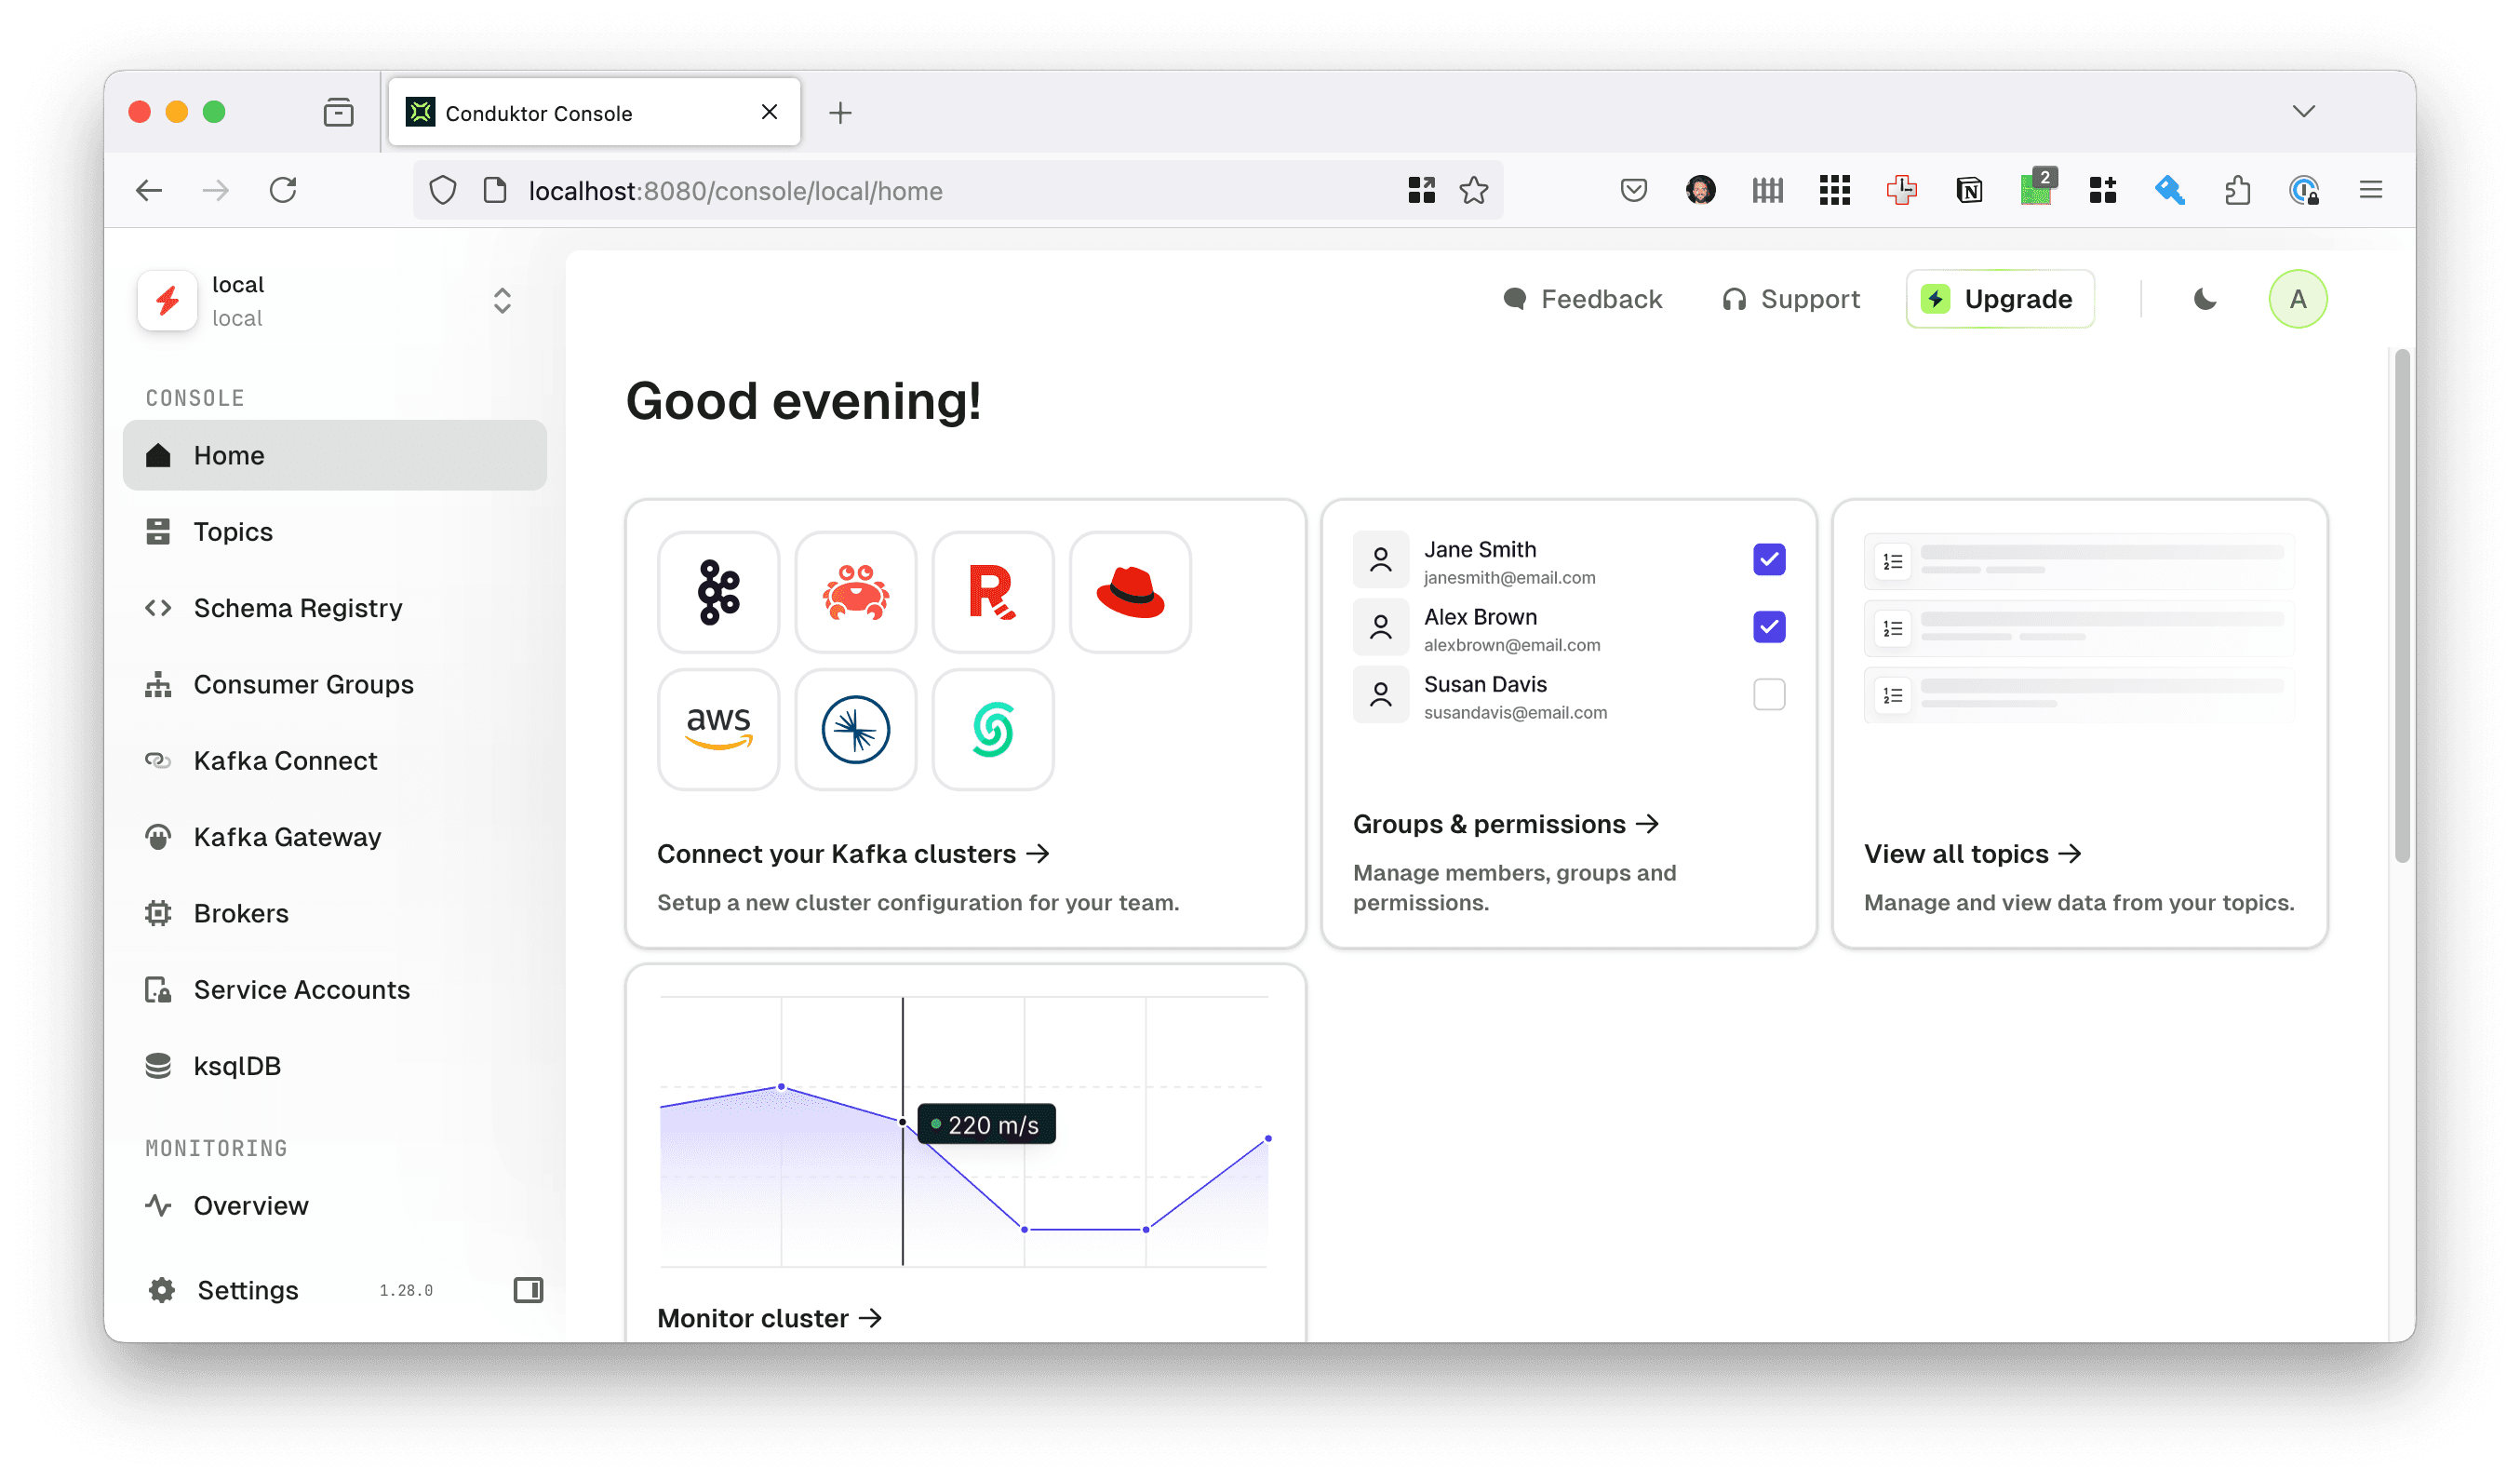
The service list reads like a mid-size startup's infrastructure: OpenEBS for distributed block storage across nodes, dual NGINX ingress controllers separating public and internal traffic, External Secrets Operator wired to AWS Secrets Manager, Velero for cluster backup, a full observability stack (Prometheus, Grafana, Loki, Tempo, OpenTelemetry Collector and Operator, Thanos for long-term metric retention), Harbor as a private container registry, Nextcloud for file sharing and knowledge management, Argo Workflows for batch processing, Kepler for energy monitoring, Goldpinger for network health, a PostgreSQL operator managing multiple database clusters, and a handful of application workloads on top.
This is not a sensible setup for a single operator. The question was never whether one person could build all of this--homelabbers build ambitious things all the time. The question is whether one person can keep it running without it becoming a second full-time job. Before AI tooling entered the picture, the honest answer was: barely, and with a growing maintenance backlog. Now the answer is: yes, sustainably, with caveats worth being honest about.
The Dependency Treadmill
The foundation of this setup's sustainability is Renovate, a dependency update bot that watches every Chart.yaml and container image reference in the repository. When an upstream project releases a new Helm chart version or container image tag, Renovate opens a pull request automatically. On an average week, that means somewhere between three and ten PRs.
Staying current matters more than most people realize. Security patches are the obvious reason, but the subtler one is migration path preservation. Falling three minor versions behind on a Helm chart is annoying. Falling three major versions behind can mean days of manual migration work, breaking schema changes, and deprecated APIs. Renovate keeps the distance between your running version and the latest version as small as possible, which keeps each individual upgrade trivial.
But there is a failure mode baked into this automation. The happy path looks like this: Renovate opens a PR, CI runs helm lint and helm template to validate syntax, the PR is reviewed and merged, and ArgoCD picks up the new commit and syncs the changes to the cluster. The problem is that linting catches syntax errors, not behavioral changes. A chart can template perfectly and still break your monitoring, change a default that matters, or introduce an incompatibility that only manifests at runtime.
This is exactly what happened in early February 2026. A Renovate PR bumped the OpenTelemetry operator chart from 0.102.0 to 0.105.0. It linted clean. It templated clean. It merged, ArgoCD synced, and within minutes a TargetDown alert fired--the operator's metrics endpoint had gone dark.
The guardrails in the repository--version pins on critical services, ignorePaths for components like the mediaserver stack that are too fragile for automated updates--are scars from previous incidents like this one. They help, but they cannot catch everything. Renovate is a force multiplier, but it requires monitoring to back it up. Automation without observability is just faster failure.
Anatomy of an Upstream Bug
This incident deserves a close look because it illustrates a failure mode that is both common and genuinely difficult to catch, with or without AI tooling.
The Renovate PR upgraded the OpenTelemetry operator Helm chart from version 0.102.0 to 0.105.0, which bumped the operator binary from v0.141.0 to v0.144.0. The chart templated cleanly. No schema changes, no removed fields, no deprecation warnings. ArgoCD synced the new manifests and rolled out the updated operator pod.
The symptom was immediate: the Prometheus up metric for the observability-opentelemetry-operator job dropped to 0, and within fifteen minutes the TargetDown alert fired. Prometheus could no longer scrape the operator's metrics endpoint.
The root cause was a transitive default change buried two levels deep. The operator binary itself--not the Helm chart, but the Go binary packaged inside the container image--introduced a --metrics-secure flag in v0.142.0 that defaults to true. This caused the manager process to serve its metrics endpoint over HTTPS using self-signed certificates, while the Helm chart's ServiceMonitor still told Prometheus to scrape over plain HTTP. Every thirty seconds, Prometheus attempted an HTTP GET, the operator responded with a TLS handshake, and the scrape failed.
What makes this particularly insidious is the gap between the component that changed and the component that configures it. The Helm chart's values.yaml schema had no field for --metrics-secure. The chart's own changelog made no mention of the change. You had to read the operator binary's release notes--a different repository, a different release cadence--to discover that a default had flipped. The upstream maintainer later confirmed in issue #2063 that "secure serving is enabled by default, despite the description in the changelog," and a fix was already in progress in PR #2004.
This is where open source shows its strength--and where it demands responsible stewardship. The upstream issue existed because the project is open and transparent; anyone can read the discussion, confirm the root cause, and verify the fix. But that openness is not free. Maintainers of projects like the OpenTelemetry Helm charts are fielding issues from thousands of downstream consumers, most of whom are running configurations the maintainers have never seen. The least a downstream operator can do is file well-researched issues: include the exact versions, the specific behavior change, the logs that prove the failure mechanism, and ideally a link to the commit that introduced it. AI tooling makes this kind of thorough issue reporting much easier--the same investigation that finds your fix also produces the evidence an upstream maintainer needs to confirm and prioritize the bug. Dumping a vague "it broke after upgrading" on an open-source issue tracker is not contributing to the ecosystem; it is adding to the maintainer's workload. The power of open source requires that its users invest in the quality of their participation.
The fix itself was two lines: pass --metrics-secure=false via the chart's manager.extraArgs field. The investigation to arrive at those two lines was the hard part.
The Investigation, Step by Step
Here is how the debugging actually unfolded, using Claude Code with MCP (Model Context Protocol) integrations to Grafana, Kubernetes, and Nextcloud. MCP is a protocol that gives AI tools structured access to external systems--instead of copying and pasting from browser tabs, the AI can query Prometheus, read pod logs, and inspect Kubernetes resources directly.
The first step was alert discovery. Through the Grafana MCP integration, Claude Code queried the ALERTS{alertstate="firing"} metric to get a structured view of every firing alert in the cluster. This returned not just the OTel TargetDown alert but also a TempoHighLiveTraces alert and several known-benign alerts (the Watchdog dead man's switch, CPUThrottling on OpenEBS io-engine pods, and openipmi.service failures on Proxmox nodes). Having the full alert landscape immediately distinguished the new problem from background noise.
Next, metric correlation. A Prometheus query for up{job="observability-opentelemetry-operator"} over the previous 24 hours pinpointed the exact moment the metric dropped to zero, which aligned with the Renovate PR merge and subsequent ArgoCD sync. This established causation, not just correlation.
Then, log inspection. Through the Kubernetes MCP integration, Claude Code pulled logs from the operator manager pod and found it repeating every thirty seconds: http: TLS handshake error from <prometheus-ip>: client sent an HTTP request to an HTTPS server. This single log line identified the exact failure mechanism--a protocol mismatch between server and client.
Spec inspection followed. Examining the pod's container spec via Kubernetes MCP revealed the command-line arguments being passed to the operator binary, confirming that --metrics-secure was not explicitly set, meaning the new default of true was in effect. Comparing this with the ServiceMonitor resource confirmed it was configured for plain HTTP scraping.
With the failure mechanism understood, root cause analysis moved to the local filesystem. The upstream Helm chart repository, cloned locally, was searched for references to metrics-secure. The operator's release notes confirmed the flag was introduced in v0.142.0 with a default of true. A GitHub CLI search surfaced the upstream issue and fix PR, confirming this was a known problem with a pending resolution.
The fix was then implemented: two lines added to the observability chart's values.yaml. During the same session, the investigation of firing alerts had revealed that the TempoHighLiveTraces threshold was stale--set at 500 when the actual steady-state baseline had risen to approximately 500, causing the alert to fire continuously. This was corrected by raising the threshold to 800 to provide meaningful headroom. Both changes were validated with helm template and pre-commit run, committed, and pushed as a single PR.
After ArgoCD synced the merged PR, verification via Prometheus MCP confirmed the up metric had returned to 1 and both alerts had cleared. The full investigation was then documented in Nextcloud as a searchable note with the scope, root cause chain, metrics used, and follow-up actions (remove the workaround once the upstream fix is released).
Total wall-clock time: approximately one hour. Estimated time without AI tooling: two to four hours, primarily because the investigation would have involved switching between a browser with Grafana dashboards, a terminal with kubectl, the GitHub web UI for upstream issues, and an editor for the fix--each context switch carrying a cognitive tax. The key insight is that the savings do not come from the AI being "smarter" than the operator. They come from the AI holding context across all of these systems simultaneously, eliminating the serial context-switching that dominates incident response for a single operator.
The Prerequisites That Make This Work
It would be easy to read the previous section and conclude that AI tooling is a silver bullet for infrastructure operations. It is not. The tooling is powerful, but it is powerful in the way a force multiplier is powerful: it multiplies whatever you already have, including zero.
Observability is not optional. Claude Code can query Prometheus only if you have Prometheus. It can correlate metrics with logs only if you are collecting both. The observability stack in this cluster--Prometheus, Grafana, Loki, Tempo, OpenTelemetry Collector, Thanos--is configured across 2,352 lines of Helm values representing months of iterative tuning. Alert rules, recording rules, ServiceMonitor configurations, retention policies, and resource limits have all been hand-tuned to balance signal quality against resource cost. If none of that existed, the AI would have nothing to query and the investigation would not have been possible.
GitOps makes AI-assisted operations safe. Every change Claude Code proposes goes through a pull request. It gets linted by pre-commit hooks, reviewed by a human, and deployed by ArgoCD. The AI cannot kubectl apply directly to the cluster. This is not a limitation--it is the most important safety property of the entire workflow. When an AI suggests a fix, you see the exact diff, you review it in the context of version-controlled history, and you can revert it with a single git operation. Without GitOps, AI-assisted operations would be terrifying rather than empowering.
MCP integrations are the bridge between chat and operations. Without MCP servers for Grafana, Kubernetes, and Nextcloud, Claude Code is a conversational interface that can read and edit local files. Useful, but not transformative for operations work. The MCP integrations are what allow it to query live metrics, inspect running pods, and document findings in a persistent knowledge base. Setting these up is not trivial--the project's integration instructions alone span hundreds of lines of structured guidance covering query generation workflows, discovery patterns, and context-pollution prevention strategies.
Institutional knowledge compounds. The Nextcloud knowledge base now contains 61 investigation notes spanning over a year of operations. Each note includes the scope, symptoms, root cause, resolution, and the exact metrics and queries used. When a new incident occurs, semantic search surfaces past investigations with similar patterns. The OTel investigation drew on the existing understanding that CPUThrottling alerts on OpenEBS io-engine pods are benign--context documented in a previous investigation. Without that documented knowledge, the alert triage step would have taken longer and risked a false lead.
The punchline: AI amplifies existing operational maturity. No monitoring plus AI equals faster hallucinations, not faster resolutions.
Broader Patterns from AI-Assisted Operations
Beyond the OTel incident, several patterns have emerged from months of using AI tooling for cluster operations.
Resource right-sizing becomes data-driven. One of the most tedious tasks in Kubernetes operations is setting appropriate CPU and memory requests and limits. The AI can query actual resource utilization from Prometheus, compare it against the values configured in Helm charts, and suggest adjustments with specific numbers. This turns a task that requires bouncing between Grafana dashboards and YAML files into a single conversation.
Multi-system investigations are where the value concentrates. The most impactful sessions are the ones that cross-cut multiple services and data sources. An alert in one namespace leads to a log entry in another, which correlates with a metric from a third. These investigations are where human context-switching costs are highest and where holding everything in a single conversation context pays off the most.
Incidental discoveries are a real benefit. The Tempo alert threshold fix was not the goal of the investigation--it was discovered incidentally while triaging the full list of firing alerts. A human operator deep in a focused debugging session might have noted the stale alert and filed it away for later. Having an AI that can address both issues in the same session, with the same context, reduces the backlog of "I'll fix that later" items that accumulate in any system.
Iteration is fast but not free. Not every fix lands on the first attempt. Under-documented upstream components, especially those with transitive dependencies or implicit defaults, sometimes require multiple rounds of investigation. The AI accelerates each round, but it does not eliminate them. Honesty about this matters: the tooling is not magic, and setting expectations accordingly prevents disillusionment.
What the Numbers Say (and Don't Say)
The claims above are qualitative. Here is what the git history and investigation records actually show.
The throughput story. Over the past twelve months, Renovate has merged between 80 and 140 pull requests per month--roughly a thousand upstream dependency updates per year. Of those, exactly three resulted in documented incidents requiring investigation: a Loki ruler config regression in December 2025, the OpenEBS etcd subchart label change in February 2026, and the OTel operator metrics flag described above. That is a 99.7% success rate for automated updates. But the 0.3% that fail are disproportionately expensive--each one demands cross-system investigation, upstream research, and careful remediation. The automation's value is not that it eliminates incidents; it is that it compresses the surface area where incidents can hide.
The adoption curve. Claude Code entered the workflow in late October 2025. Usage peaked immediately: 79 co-authored commits in November 2025, covering a burst of proactive work--resource right-sizing across the cluster, Thanos setup for long-term metric retention, and alert rule tuning. By January 2026, that had settled to roughly ten co-authored commits per month, each targeting a specific incident or operational task. The pattern is not "AI does everything now." It is "AI enabled a one-time paydown of accumulated operational debt, and now assists with the incidents that remain."
The honest MTTR picture. It would be satisfying to report a clean before-and-after comparison of mean time to resolution. The data does not support one. Structured investigation notes did not exist before AI tooling was introduced, so there is no documented baseline to compare against. What exists is the resolution timeline for the three Renovate-triggered incidents: the Loki regression was caught and fixed same-day, the OTel incident was investigated in roughly an hour, and the OpenEBS upgrade took two days to detect and four hours to resolve once investigated--requiring significant manual intervention that AI could not shortcut. Three data points do not make a trend. MTTR depends on the nature of the failure, not just the tooling available to investigate it.
The documentation dividend. The most measurable change is not speed--it is the 61 investigation notes that now exist in the knowledge base. Each preserves the exact queries, timestamps, and reasoning chain from an investigation session. This institutional memory is what makes future MTTR improvements possible: when the OTel TargetDown alert fir
ed, the investigation started by triaging it against known-benign alerts like OpenEBS CPUThrottling--context documented months earlier. The next time an upstream dependency breaks something, the investigation starts with context instead of from scratch. The compounding value of this documentation is harder to quantify than a response time metric, but it is arguably more important.
The New Economics of Small Teams
Platform engineering used to have a minimum viable team size. Below a certain threshold of services and complexity, the operational overhead was manageable by one person. Above it, you needed a team--not because the work was intellectually beyond one person, but because the context-switching and interrupt-driven nature of operations work exceeded one person's bandwidth.
AI tooling lowers that threshold. It does not eliminate it, but it meaningfully shifts where the line falls. A cluster with 25 Helm charts and 33 upstream dependencies generates a steady stream of updates, alerts, and subtle breakages--roughly a thousand Renovate-driven updates per year, with only a handful requiring human intervention. The sustainable operations loop now looks like this: Renovate automates dependency updates, ArgoCD automates deployment, the observability stack automates detection, and Claude Code with MCP integrations accelerates investigation and resolution. Each link in the chain reduces the human time required per incident.
What changed is not any single capability but the closing of a loop. Before MCP integrations, the AI could help you write Helm values but could not check whether the change actually worked. Before the observability stack, there was nothing to check against. Before GitOps, there was no safe way to let an AI propose changes. Before Renovate, staying current was itself a full-time job. Each piece existed independently; the economic shift comes from connecting them into a cycle where the output of each stage feeds the next.
The key word is "sustainable," not "effortless." You still need to build the observability stack. You still need to review every pull request. You still need to understand your systems deeply enough to evaluate the AI's suggestions critically. The operational maturity cannot be outsourced. But for a single operator who has already invested in that maturity, AI tooling is the difference between a homelab that slowly drowns in maintenance debt and one that stays current, well-monitored, and--against all reasonable expectations--actually production-grade.
The real unlock is not speed. It is continuity. Context is preserved across investigations, operational patterns are reinforced through documentation, and mean time to resolution stays bounded even as the system grows. For a team of one, that is the margin between sustainable and unsustainable.
The upstream issue referenced in this post is tracked at open-telemetry/opentelemetry-helm-charts#2063, with a fix in PR #2004.
This blog post was written with the help of AI, and reviewed by a Human